
-
What the 30% rule actually says
The 30% rule in AI is a practical guideline: aim for AI to handle about 30% of a workflow (by volume, time, or cost) in your first iteration, with humans covering the rest. In other words, start by capturing the most repetitive, standardized chunk—not the corner cases.
This 30% target appears in three common forms:
- Coverage: AI completes ~30% of tasks end‑to‑end without human help.
- Time savings: AI reduces human effort in the workflow by ~30%.
- Quality/throughput: AI boosts output or quality by ~30% on scorable tasks (e.g., drafts, summaries, triage).
Why 30%? It’s big enough to matter to the business and small enough to be safe, governable, and quick to ship. It becomes your “minimum viable automation” goals: measurable upside, manageable risk.
-
Where the 30% rule comes from (and what evidence supports it)
The 30% heuristic reflects two realities: (1) many knowledge‑work tasks have a sizable chunk that’s repeatable enough to automate, and (2) early AI gains are meaningful but not total. A growing body of research shows strong—but not perfect—productivity lifts.
- Controlled experiment with knowledge workers: Researchers at MIT found large‑language‑model assistance improved task performance and speed, with an average productivity lift of roughly one‑third on writing and analysis tasks. Experimental Evidence on the Productivity Effects of Generative AI.
- Software development: In a GitHub study, developers using AI pair‑programming completed tasks significantly faster. Quantifying GitHub Copilot’s impact.
- Broad task automation potential: McKinsey estimates that current GenAI and automation could technically automate a substantial fraction of work activities across occupations—far from 100%, but enough to reshape workflows. The economic potential of generative AI.
The 30% rule takes these findings and translates them into a safer operational stance for your first production deployments.
-
What the 30% rule is not
The 30% rule is a design and rollout heuristic—not a law of nature. It doesn’t mean every team will see exactly 30% gains, nor that you should stop at 30%. Think of it as an initial target that reduces risk, speeds time‑to‑value, and creates room for governance.
It’s also not a permission slip to cut staff. The best outcomes come from redeploying time: more customers served, faster cycle time, and better quality—rather than simply “doing the same work with fewer people.”
-
How to apply the rule: find your first 30%
Start by hunting for processes with high repetition, clear inputs/outputs, and measurable outcomes. Great candidates include triage, drafting, summarization, classification, extraction, routing, QA checks, and code generation.
Typical 30% targets by function
Function Good first target Why ~30% is realistic Customer support Auto‑draft responses for common intents; triage High intent repetition; templates + retrieval help Sales Personalize outreach drafts from CRM + news Structured data + short, audit‑able outputs Finance/AP Extract/validate invoice fields; flag exceptions Semi‑structured docs + clear acceptance criteria HR Summarize resumes; screen for basic criteria Standardized fields; human final decision Legal/Policy First‑pass redlines; clause lookup Retrieval‑augmented generation with citations Engineering Code suggestions, tests, docstrings Strong tooling support and benchmarks If a workflow has zero standardization or the output can’t be objectively checked, it’s usually a weak candidate for a 30% first win.
-
Measure before you automate (then prove your 30%)
Baseline first. If you can’t measure it, you can’t prove it—let alone scale it. For each candidate workflow:
- Define scope and unit: e.g., “per ticket,” “per invoice,” “per feature.”
- Time study: average handle time, wait time, and rework rate.
- Quality: accuracy, compliance defects, or satisfaction scores.
- Volume: weekly/monthly units; peak vs. average.
A simple way to quantify a 30% win is to compare pre‑post for the same unit:
- Time savings: (Baseline minutes − AI minutes) / Baseline minutes.
- Coverage: share of items completed without human edit.
- Quality: change in accepted‑as‑is rate or error rate.
TipA quick sizing formula
Potential annual hours saved ≈ Volume × Baseline minutes × Target savings (start with 0.30). If the result isn’t meaningful at team scale, pick another workflow.
-
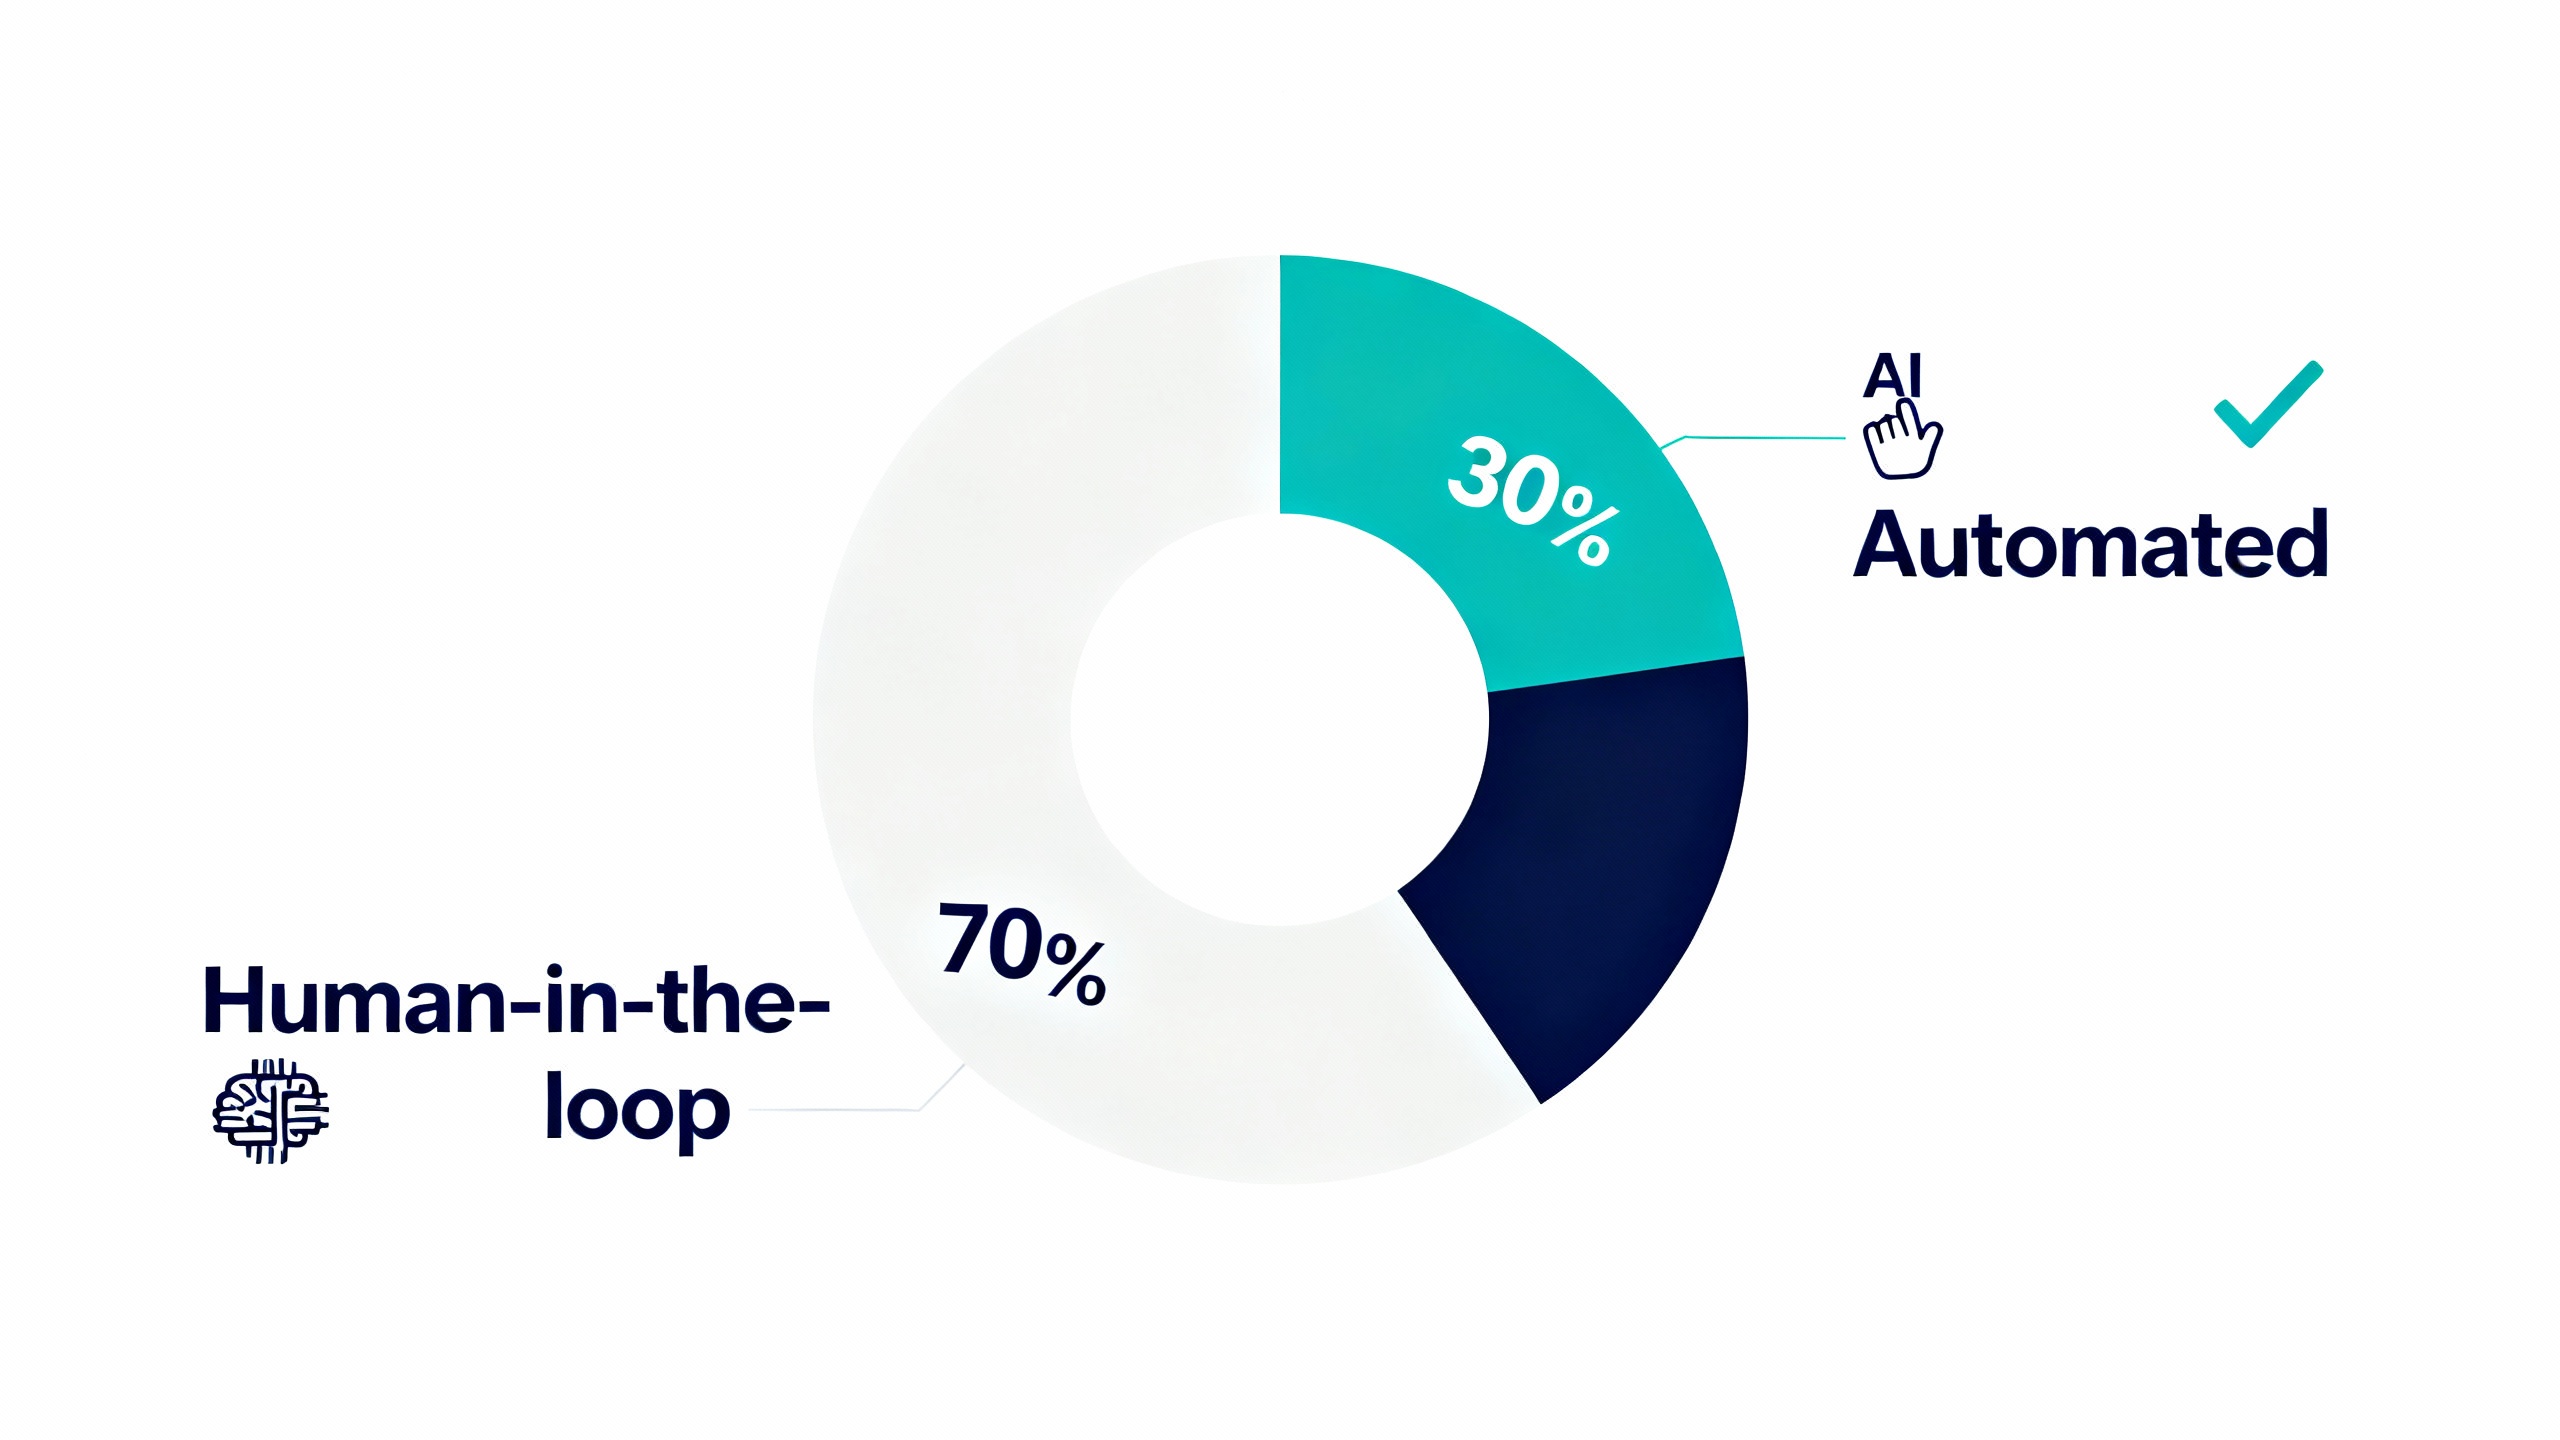
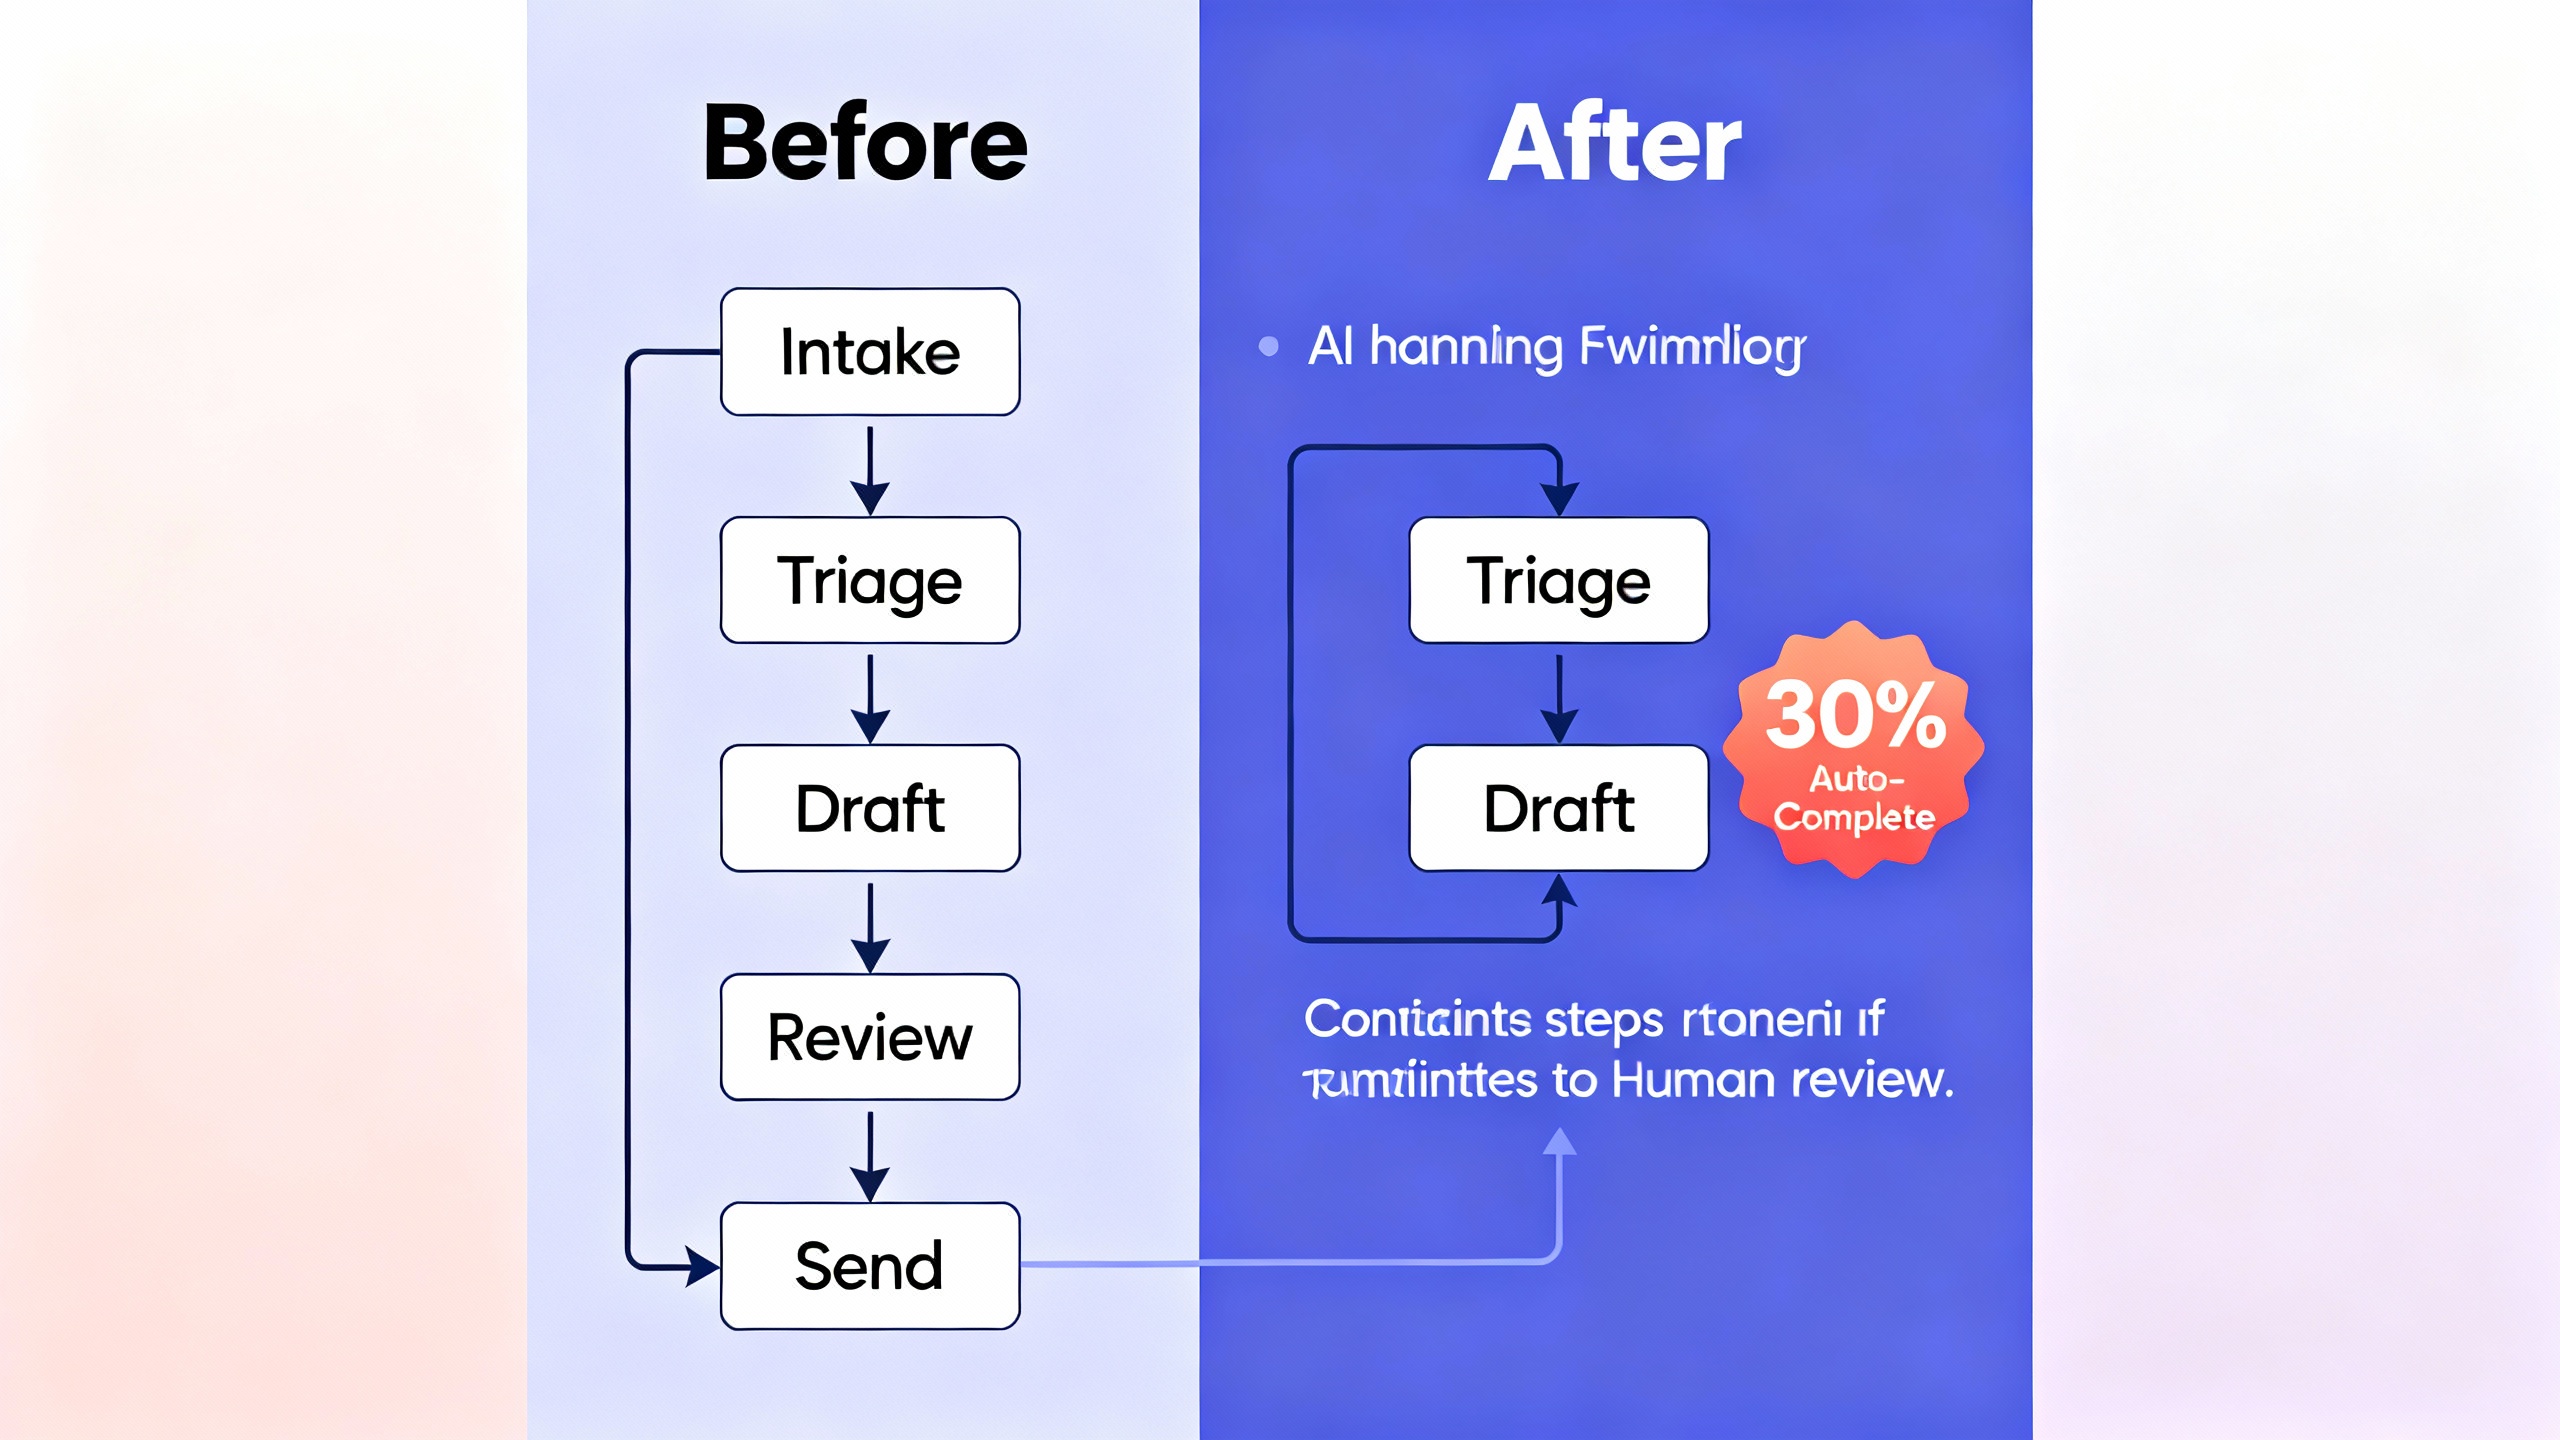
Human‑in‑the‑loop: the 30/70 operating pattern
A reliable way to apply the rule is a 30/70 split: automate the stable 30% and route the rest to humans, with clear guardrails:
- Confidence gating: If model confidence (or a proxy score) is below a threshold, send to human. Start with a conservative setting—e.g., accept only the top ~30% of cases with high scores, review the rest.
- Well‑typed exceptions: Log why items were routed to humans (missing data, ambiguous intent, low confidence) to continuously shrink the 70%.
- Traceability: Store prompts, model versions, retrieval sources, and decisions for audits.
-
A 30/60/90 plan to ship your first 30%
- Days 1–30: Baseline and prototype
- Map the workflow, isolate the repetitive steps, and define acceptance criteria.
- Collect a gold‑label dataset (50–200 examples often suffices for a v1) and instrument metrics.
- Build a thin prototype: retrieval‑augmented generation (RAG) or structured extraction with deterministic post‑processing.
- Days 31–60: Pilot and govern
- Run A/B or shadow mode with a small team. Track coverage, time saved, and error types.
- Add confidence gating, PII handling, and observability. Establish rollback triggers.
- Update SOPs and training for a human‑in‑the‑loop flow.
- Days 61–90: Prove value and expand
- Hit or exceed ~30% target on at least one primary metric (coverage or time saved).
- Document outcomes and exceptions. Decide where to push beyond 30% next.
- Days 1–30: Baseline and prototype
-
Concrete examples of the 30% rule in action
- Customer support triage and drafting
- Approach: Classify intents, retrieve policy snippets, draft replies; agents approve or edit.
- Result pattern: 25–40% of tickets handled with minimal edits; average handle time down ~30% on covered intents; CSAT stays flat or rises with faster responses.
- Accounts payable (invoice processing)
- Approach: Extract fields, validate against PO, auto‑approve when all checks pass; exceptions to humans.
- Result pattern: 30% of invoices processed straight‑through; cycle time drops for the AI‑approved set; fewer late fees; auditors get complete traces.
- Developer assistance
- Approach: Code completion, doc generation, tests; developers remain final approvers.
- Result pattern: Significant speed gains on routine coding tasks. See GitHub’s study on Copilot for reference.
The point isn’t the exact number; it’s the operational discipline: automate a meaningful slice, prove value, then expand.
- Customer support triage and drafting
-
Pitfalls and how to avoid them
- Chasing 100% from day one: The last 10% of edge cases can cost more than the first 30%. Start with the easy third; earn the right to expand.
- Unmeasured success: If you don’t instrument coverage, error types, and time saved, you can’t prove value or learn.
- Weak data hygiene: Garbage in, garbage out. Clean inputs and retrieval sources. Lock down PII.
- Confidence theater: A single probability score is not enough. Combine confidence with rule checks, anomaly detection, and human review.
- Tool sprawl: Centralize prompts, templates, and evaluations. Treat them as versioned assets, not one‑offs.
-
When to push beyond 30%
Once your first slice is stable and governed, expand deliberately:
- Add decision support to the remaining 70% (drafts, checklists, citations) to lift human throughput.
- Reduce exception categories by improving data coverage or adding deterministic validators.
- Raise the confidence threshold gradually as you build evidence on safety and quality.
A useful mental model is “peel the onion”: each new 10–20% gain comes from eliminating a specific reason the system defers to humans (missing context, ambiguous input, low confidence). Repeat the cycle until marginal gains flatten—or risk and cost outweigh benefit.